Hale Stewart
The Six Flaws of Bush’s Economy
For those of you who need economic talking points for the remainder of the campaign, here they are.
These are not mild policy disagreements. Instead they are serious fundamental economic flaws currently existing in the US economy. They are fundamental weaknesses that given the right set of circumstances will create big problems down the economic road.
Update [2006-10-2 8:32:5 by bonddad]:: For those of you who have an MP3 player, I have several podcasts that concisely explain these points. Special thanks to Pyrro at MLW for the help with those.
The Weakest Job Growth of the Last 40 Years
But so far, as the charts show, there are just 3.5 percent more jobs than at the end of the last recession. That is less than half the lowest of the nine previous moves -- a gain of 7.6 percent in the period after the 1953-54 recession. And that figure was held down by the fact that another recession, in 1957-58, had taken place by then.
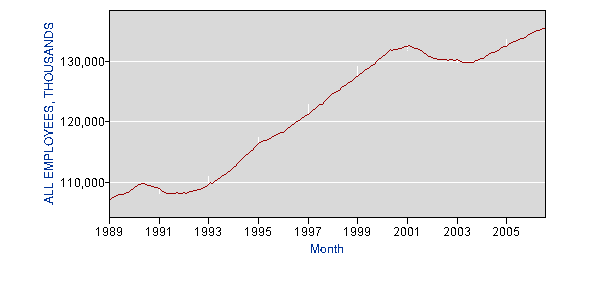
This expansion started in November 2001 Not 2003 as the administration continually claims. In November 2001 there were 130,883,000 establishment jobs in the US. That number was 135,550,000 in August 2006 for a total gain of 4,667,000 jobs. That breaks down to 80,465/month. Here's a chart of total establishment job growth from 1998. Notice that after the economy exited the recession in November 2001 the rate of job creation was lackluster for at least another year and a half:
The US economy must create 150,000 establishment jobs/month to keep up with population growth and natural economic attrition (lay-offs, businesses closing etc...). In other words, the US economy's rate of job creation is sub-standard by a wide margin. It's a vast difference from previous expansions.
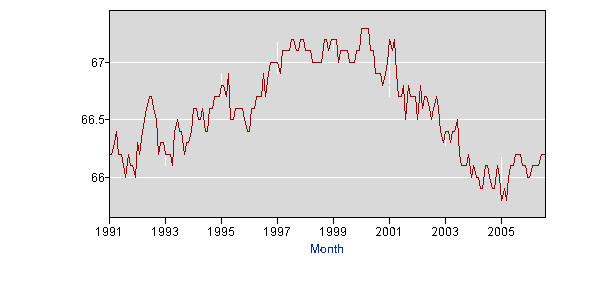
So - why is the unemployment rate so low? A smaller percentage of the available working age population that could work is working. A statistic called the Labor Force Participation Rate (LPR) measures the percentage of the available working population that could work and is working. Notice how that number is still low even though the expansion is almost five years old:
In other words, fewer people who could be working are in fact working. That's not good.
Stagnant Wages
This expansion started in November 2001 when the average hourly wage of production workers was $14.70. The latest reading in August 2006 was $16.79 for an overall increase of 14.21%. Over the same period, the inflation index increased from 177.4 to 203.9 or an increase of 14.93%. Therefore, on an inflation adjusted basis wages have decreased .72% (-.72) for the duration of this expansion.
The Census Bureau also noted this development in their latest release of household income information.
Nationally, 2005 marked the first year since 1999 in which real median household income showed an annual increase
The bottom line is 80% of the population isn't making any more money now than they were 5 years ago despite almost 5 years of economic expansion. There isn't any trickle down occurring at the macro level.
Low National Savings
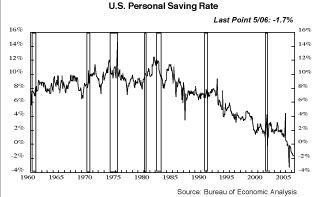
The above chart graphs the path of personal/individual savings since 1960. Starting in the 1990s Americans stopped saving and started consuming. The end result of this behavior is the US savings rate has been negative for the last 5 quarters.
There are two other recent studies that confirm the lack of savings in the US.
The single largest source of wealth for retirees is often an illiquid asset, real estate.11 It is useful, therefore, to look separately at non-real-estate assets for a realistic picture of available assets retirees have accumulated. Although 94 percent of families headed by persons ages 45 to 54 held at least one type of non-real-estate financial asset in 2004, the median holdings of financial assets for this group were only $38,600. These data include 58 percent of families that held a median of $55,500 in retirement accounts (which include individual retirement accounts or IRAs), but only 18 percent that held the next largest asset category, pooled investment funds ($50,000). Even fewer--less than 7 percent--held the third and fourth largest asset categories, other managed assets and bonds ($43,000 and $30,000, respectively) (see Table 3, next page). For the average person, financial assets would not last long in retirement.
The center's analysis found that nearly half of today's workers, at their current savings rate, will be unable to fund a comfortable retirement. People will need to work longer or save more, Munnell, one of the authors of the research, said in a conference call.
Boston College says its retirement index goes a step beyond other research in taking into account the income that people would get, theoretically, from tapping their home's equity.
What happens to someone with no savings who has an economic set back like losing a job or a major medical issue? They are essentially out of luck. This could create a cascading effect at the macro-economic level, especially during a recession.
Household debt
According to the Federal Reserve's Flow of Funds Report, total household debt outstanding was $7.661 trillion in the fourth quarter of 2001 and $12.272 trillion in the second quarter of 2006. Total mortgage debt outstanding increased from $5.929 trillion to $9.331 trillion, making mortgage debt responsible for 72.98% of this increase.
Here's a graph of total household debt outstanding.
There is no bright-line economic rule regarding household debt where a number above the line is bad and a number below the line is good. However, household debt is now over 90% of GDP and over 120% of disposable income - both historically high levels. The short answer is there is a ton of debt in the system which households will have to pay back in the future.
Fiscal Irresponsibility
Bush's policies essentially mirror Reagan's policies, with regrettably similar results. Bush cut individual taxes arguing these cuts would pay for themselves.
According to theCongressional Budget Office tax receipts from individual taxpayers were 994 billion in 2001 and 927 billion in 2005. (as of this writing the 2006 figures were not available from the CBO). Notice how 2005 receipts were 6.7% below 2001 receipts.
Actual revenue after Bush's tax cuts has decreased a little over 20% after adjustiing for the GDP price deflator.
As a result of the decrease in revenue from individual tax revenue, both Reagan and Bush have increased the use of deficit financing.
And despite claims to the contrary, the deficit is nowhere near under control. According to the Bureau of Public Debt, the Bush administration has increased total outstanding federal debt by over 550 billion per year for the last 4 years.
Although Reagan's policies didn't work, that certainly didn't stop Bush's fact-free approach to policy from trying it again. It's should surprise no one he got the same results.
The international trade deficit
What holds it all together is a massive and growing flow of capital from abroad, running to more than $2 billion every working day, and growing. There is no sense of strain. As a nation we don't consciously borrow or beg. We aren't even offering attractive interest rates, nor do we have to offer our creditors protection against the risk of a declining dollar.
Most of the time, it has been private capital that has freely flowed into our markets from abroad -- where better to invest in an uncertain world, the refrain has gone, than the United States?
More recently, we've become more dependent on foreign central banks, particularly in China and Japan and elsewhere in East Asia.
It's all quite comfortable for us. We fill our shops and our garages with goods from abroad, and the competition has been a powerful restraint on our internal prices. It's surely helped keep interest rates exceptionally low despite our vanishing savings and rapid growth.
And it's comfortable for our trading partners and for those supplying the capital. Some, such as China, depend heavily on our expanding domestic markets. And for the most part, the central banks of the emerging world have been willing to hold more and more dollars, which are, after all, the closest thing the world has to a truly international currency.
The difficulty is that this seemingly comfortable pattern can't go on indefinitely. I don't know of any country that has managed to consume and invest 6 percent more than it produces for long. The United States is absorbing about 80 percent of the net flow of international capital. And at some point, both central banks and private institutions will have their fill of dollars.
I don't know whether change will come with a bang or a whimper, whether sooner or later. But as things stand, it is more likely than not that it will be financial crises rather than policy foresight that will force the change.
Since this article was published in April 2005, the US consumption of world savings has dropped to 70%.
There are numerous reasons why foreigners would start to divert their excess savings away from the US. First, there are plenty of economies in the world with strong growth prospects. India, China and Russia top the list, although there are plenty others. Secondly, Asian economies increase their level of internal investment to the levels of the late 1990s. As IMF economist Raghuram Rajan observed in a January speech, Bernanke's "Global Savings Glut" is in fact a decrease in Asian investment starting in the early 2000s. However, Asia does not have to be the only region that increases internal investment. There are a host of developing economies that could use the investment. Third, foreigners could simply tire of lending money to a country whose fiscal house is in complete disarray, especially in comparison to countries with a strong export account balance.
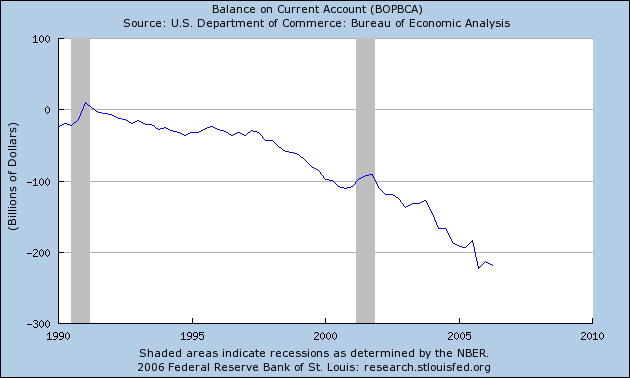
In short, there are plenty of reasons why the current account deficit should concern Americans and economists.
Conclusion
The US economy has six fundamental structural problems. Weak job growth, weak wage growth, little personal savings, massive personal debt levels, a federal deficit out of control and a mammoth trade deficit. Theses are not mere blips on the economic horizon; they are problems of large proportions. These problems have the potential to cause major problems for the economy if they are not dealt with.
Hale Stewart: Author Bio | Other Posts
Posted at 10:23 AM, Oct 02, 2006 in
Economy
Permalink | Email to Friend


